My professional career has been closely tied to the housing market since its beginning.  I was “pulled” into residential real estate by my father who saw it as a great opportunity for me to make a good income while I worked on my Bachelor’s degree.  It was during those early days that I began to notice discrepancies between what the market needs versus what the market offers.  I was bothered by this because my intuition recognized there was more need and desire for housing than what the market was delivering.

While I was working on my Master’s degree I began to understand why there was a gap.  Zoning was a prohibiting factor.  Zoning had become hyper-focused on regulating use and was now written in a way that created a market caste system that primarily favored single family detached homes, townhomes, and stacked flats (condos and apartments).  Anything else was off the table – regardless of whether the need or desire for other historical housing types was warranted.

I am now at a point in my career where my mind is constantly recognizing analytics that seem to identify trends associated with problems in the housing market.  I recently went down a rabbit hole of information that focused on trends within coupling rates and total fertility rates.  These data sets, in isolation, may not seem to be directly connected to housing – but they are.  Both sets of statistical data have a bearing on household creation that then extrapolate into the associative wants/needs tied to housing.

This all started when I came across the set of graphs shown below which demonstrates the heavy decline in coupling and total fertility rates around the world:

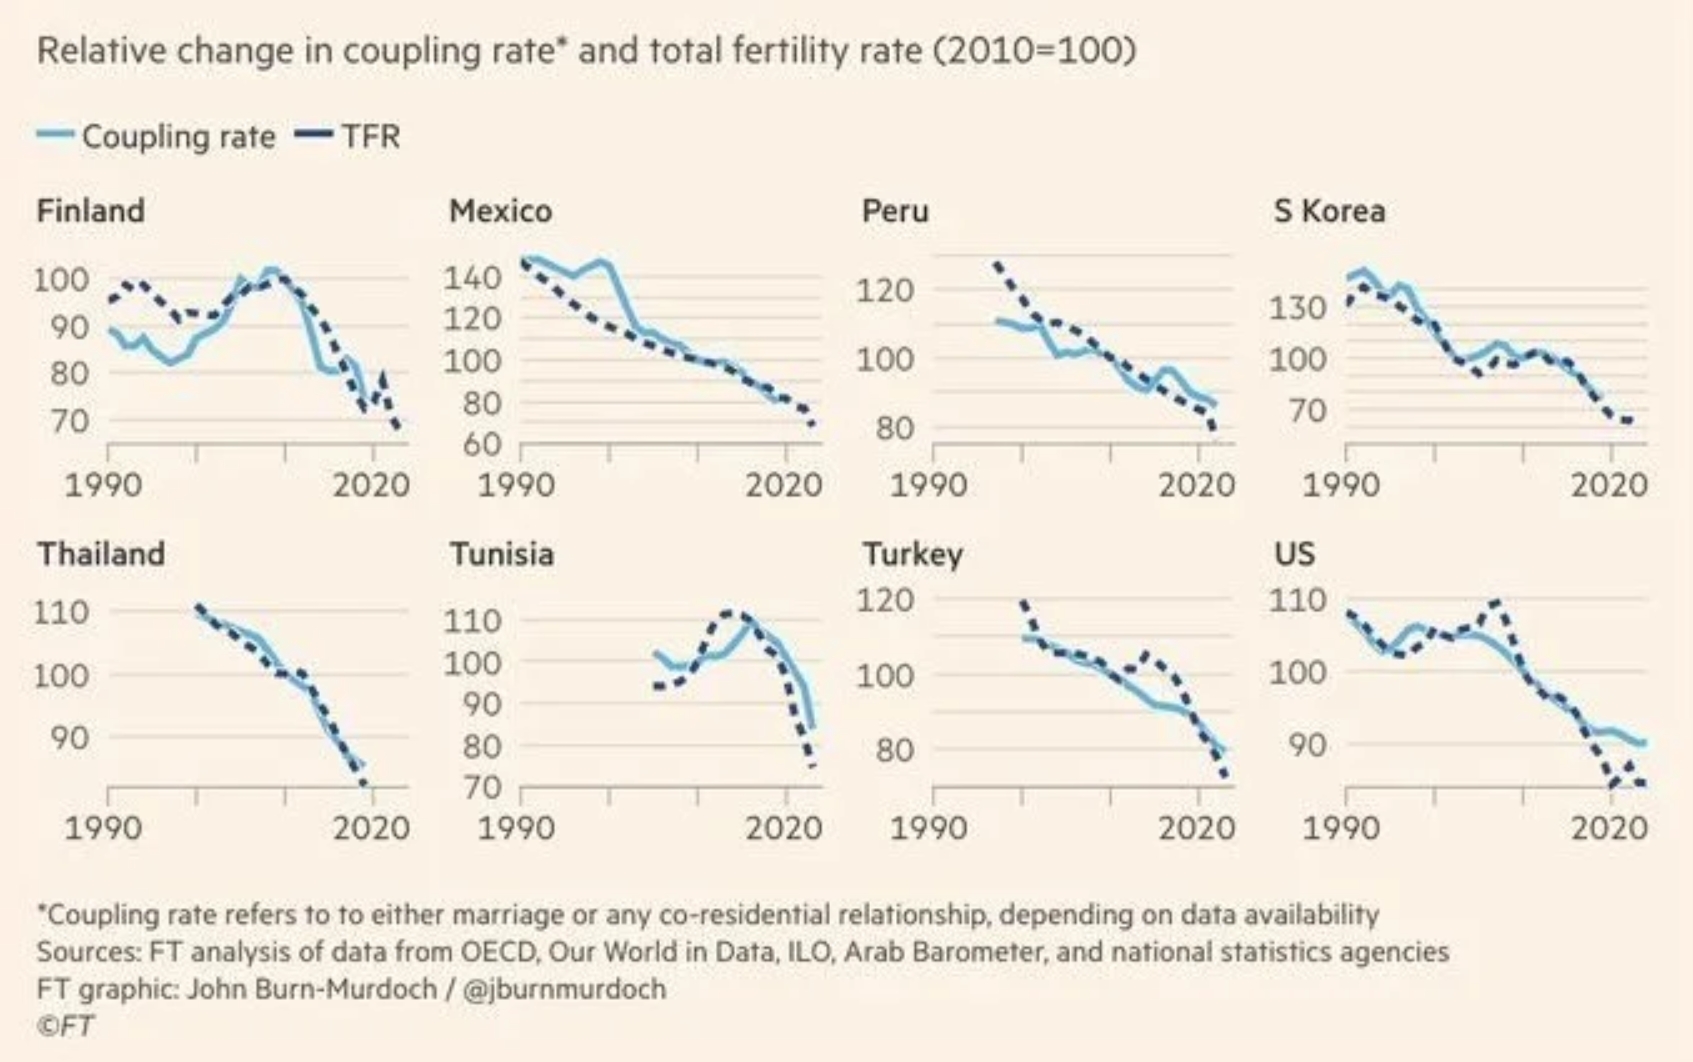
Coupling and Total Fertility Rates (1990 - 2020)


For clarification, a coupling rate refers to the rate at which individuals form romantic partnerships or marriages within a given population. It is a measure of how frequently people are entering into committed relationships, such as marriages or long-term partnerships, over a specific period of time. In demographic studies, the coupling rate is often analyzed alongside other metrics like birth rates and divorce rates to understand broader social trends and their implications for population growth and family structures.

It's important to understand these trends.  It's also important to grasp that Utah is not immune to these trends.  Utah's coupling rate follows world trends (just not as significantly) with the rate of marriage dropping (never-married women rising from 22.0% in 1980 to 28.3% in 2021) while divorce rates in Utah have decreased since the 1970s as shown below: 

    • 1970: ~4.3 per 1,000 population. 
    • 1980: ~5.0–5.3 per 1,000 (peak). 
    • 1990: ~4.7 per 1,000. 
    • 2000: ~4.1 per 1,000. 
    • 2010: ~3.7–3.9 per 1,000; 10.1% of ever-married women divorced. 
    • 2018: ~3.3 per 1,000; 9.8% of ever-married women divorced. 
    • 2023: ~3.0–3.2 per 1,000. 

While these statistics give the appearance that the rate of divorce is dropping these numbers only account for when marriage occurs (since a divorce can only be counted if a marriage takes place first).  People still get together, combine into households – without marriage, and split up.  This would suggest that if break ups could be accounted for, the dissolution of relationships would be significantly higher than just a measurement of divorces. 

Also important to note is the falling number of marriages nationally.  According to the National Center for Health Statistics adults in the United States are “increasingly postponing marriage” and “a record number of current youth and young adults are projected to forego marriage altogether.”  As marriage continues to evolve as being more transactional in nature and/or unnecessary to a life fulfilled both the number of marriages and number of divorces will fall.

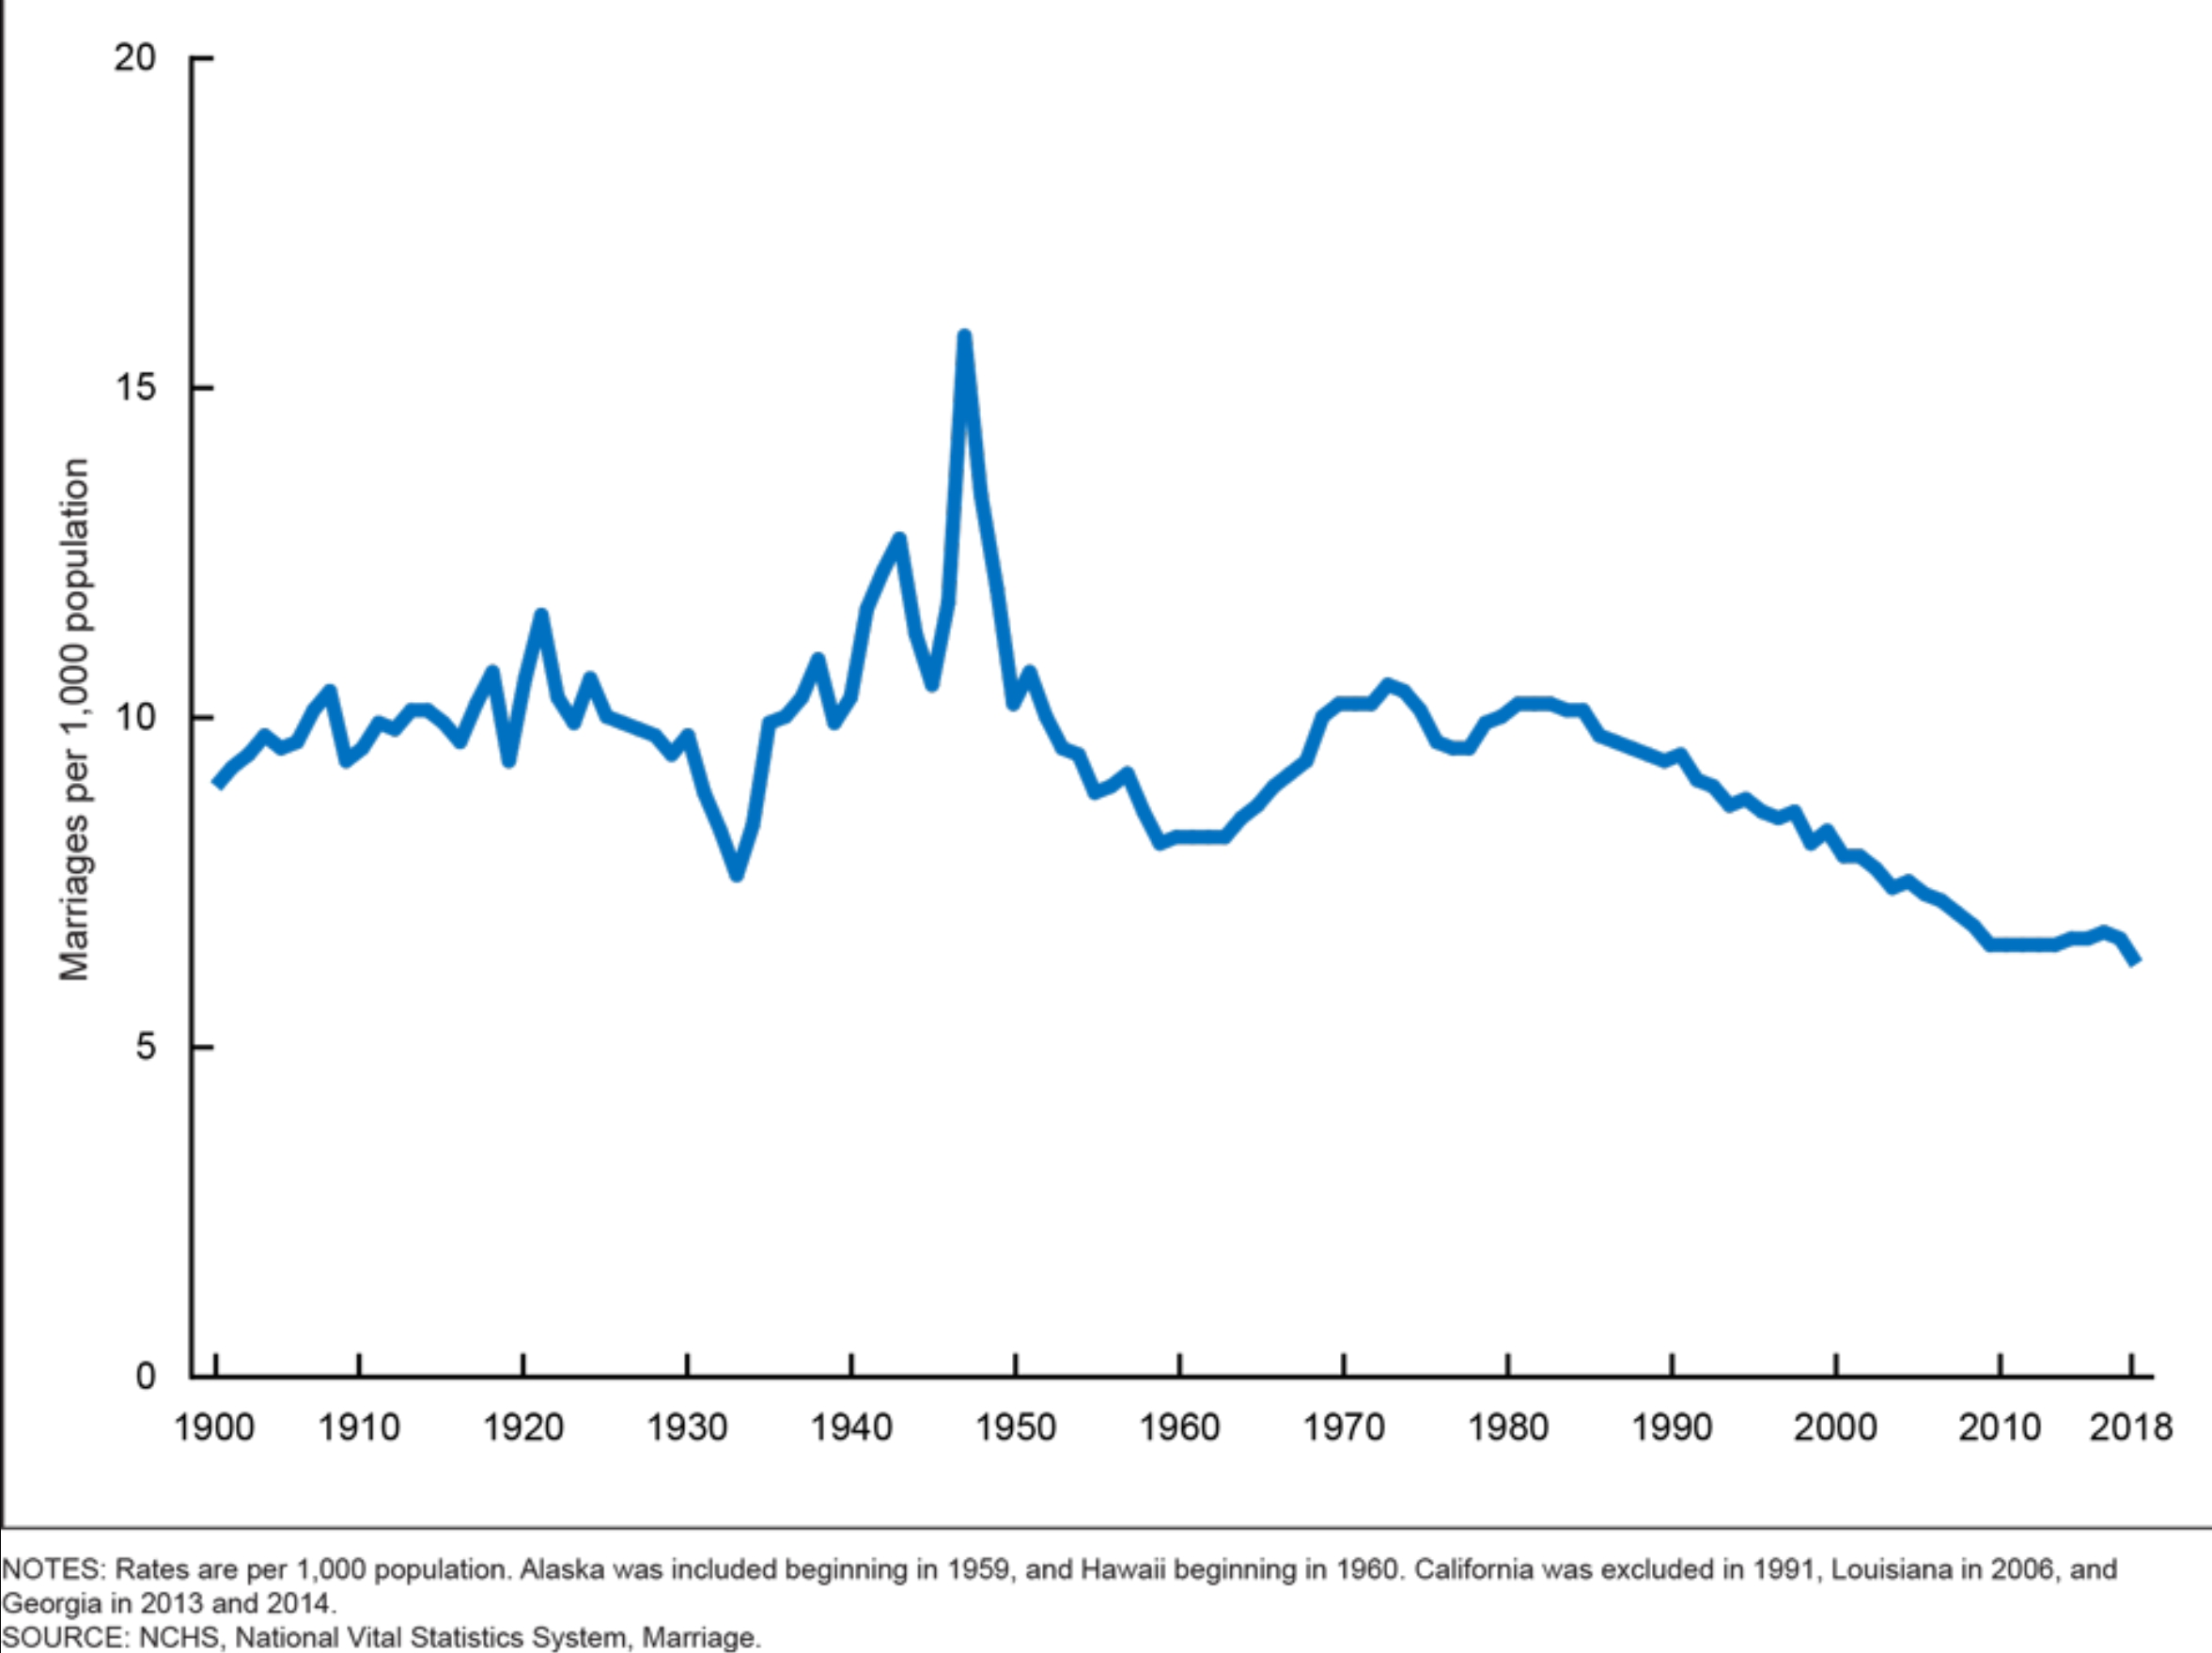
Marriage Rates: United States (1900 - 2018)


The total fertility rate (TFR) is a demographic measure that estimates the average number of children a woman would have over her lifetime, assuming she experiences the current age-specific fertility rates throughout her reproductive years (typically ages 15-49). It is a useful indicator for understanding population growth and demographic trends.

The TFR is calculated by summing the age-specific fertility rates for all age groups in a given year. A TFR of about 2.1 children per woman is considered the replacement level, meaning it is the rate at which a population exactly replaces itself from one generation to the next, without migration.

Utah's total fertility rate has reduced every decade as follows (keep in mind replacement level - which is the balancing of births to deaths and keeping population numbers stable long term - is recognized as 2.1): 

    • 1970: 4.30 
    • 1980: 3.50 
    • 1990: 3.00 
    • 2005: 2.45 
    • 2014: 2.33 
    • 2016: 2.15 
    • 2018: 1.99 
    • 2021: 1.92 
    • 2022: 1.85 
    • 2023: 1.80 

You may be asking yourself why I went down this rabbit hole in the first place.  There are a few key reasons for it:

    • I have found there is a common misnomer among Utah residents in thinking that “we are different” and that Utah’s trends buck the system of what happens nationally.  Hopefully you can see from what I have shown that this is a fallacy.  Utah may be delayed in its path to following national trends, but Utah eventually falls in line – for better or worse.

    • Reading between the lines when looking at the coupling rate and total fertility rate is a recognition that household types are changing.  Within society as a whole household types are becoming incredibly diverse.  There are young and mature singles, blended and multi-generational families, young and mature couples, and single parents of young and older children that are all outside of what used to be viewed as the traditional norm of a married couple with children.  In fact, according to the U.S. Census Bureau's report "America's Families and Living Arrangements: 2022" married couples with children are now a statistical minority.  In the U.S. married couples with children under the age of 18 accounted for around 40.3 percent of households in 1970 but only 17.8 percent in 2022, a decline of around 23 percent.  On the flip side of this, non-family households, such as those with individuals living alone, increased from 19% in 1970 to 36% in 2022.

    • With these shifts in household types comes the need to provide housing types that address the needs that go with these ever-diversifying household types.  Wants and needs are different, but they aren’t being addressed in what the market is delivering.  The impact of this leads to buying homes that are a compromise and often stretch household budgets to pay for that compromise because what the market has available doesn’t match what is needed.

When combining these trends with what can be learned regarding the household type / housing type relationship there are several key takeaways to be pointed out and learned from: 

    • Household types come in many different forms.  Some of those forms are recognized as being more traditional in nature while others may be in non-traditional forms.  As adults age the form that their household takes will change over time, and in those changes will be different wants and needs associated with their housing.

    • Housing opportunities should be provided for all potential stages of a person’s life cycle.  Whether those life cycle stages are traditional or non-traditional there should be housing alternatives that are inclusive to any and all conditions.  The diversity of needed housing should occur by price, size and type.

    • With every household being created through either non-marriage or dissolution of marriage comes a household type which demands housing types and lifestyle needs which don't necessarily match the predominant housing type of single-family detached homes which have historically been meant for traditional families. 

    • With the needs that come from non-traditional household types come the necessity for understanding how to deliver missing-middle housing.  With missing-middle housing comes an understanding that its delivery should come inclusively with other housing types – not in isolation of a singular housing type. Housing variety should be experienced within the same neighborhoods and on the same streets.  The tighter the knit the better.

    • Communities fare best when there are no gaps in their population.  To minimize gaps in the population an abundance of housing types is imperative.

    • With every divorce comes a doubling in household creation.  This means a household is typically going from a traditional family household type (married with kids) to two non-traditional household types.  With a change in the TYPE of households comes a change in the TYPE of housing needed with the doubling of the households.

These statistics have clear impacts on not just the AMOUNT of housing that is needed, but also the TYPES of housing that need to be built.  These trends are disturbing on the one hand but provide tremendous opportunity on the other.  What we need to be cognizant of is the NUMBER of households being created by all these different trends and the TYPE of households being created.  The development and homebuilding community needs to learn how to become well equipped to take advantage of all this.  If this can happen both business and consumer interests can win.  Let’s look past status quo thinking and behavior and make all this a reality.

Joshua Stewart


Before and after images of places like Delhi India, where the skies are now blue and clean because of quarantine should teach us Utahns that the price of an unregulated swelling economy is caustic and nasty.  The governor wants to re-start our economy.  Let’s not re-start our old ruinous one.  Utahns can choose a future that avoids air polluting industries and also reduces truck and vehicle miles traveled.  We can continue to choose to drive less, save time, and retrofit our habits and communities to enable telecommuting, walking, and cycling.   After the quarantine, employers should continue to enable work from home (or library, bakery, book store, etc.)  and build fewer office buildings.  Schools, K thru higher ed should continue more online learning and we should need fewer school buildings.  You might say, wait, that will disrupt our economy and old way of life?  Was your old life really so great?  Like we’ve done with the quarantine, we need to focus on improving our neighbor’s and children’s quality of life as well as our own.  With the quarantine, more people are out walking, cycling, gardening and using sidewalks, trails, parks, and bike lanes.  There is still plenty to build, re-build and do, and community leaders should take note and work to build safer and more enjoyable active transportation routes and let children and adults interact socially in healthier more beautiful places.  UDOT should be able to reduce traffic lanes and focus more on local sidewalks, bike lanes, daylighting our forgotten streams and creeks and retrofitting towards a new blue sky economy.  Ask yourself, did I really need that cubicle and long commute to do my work?  Did my child really need to sit in that same classroom space for 6-7 hours every day? Instead of more parking lots and high rise offices, we might preserve and create more orchards, parks, streams, and gardens?  We’ll all be healthier, wealthier, and happier if we leave the old economy behind.    

Joshua Stewart

State Street is the perfect place for re-development.  It’s the historic core of Salt Lake County, connects numerous cities, and terminates with a view of the beautiful State Capital.  Now is the time to maximize existing infrastructure and make State Street into a grand, beautiful urban walkable corridor.  One of the keys is for UDOT to allow a reduction in car lanes on State Street so the street can be slower speed, less dangerous to cross, more beautiful with shade trees, and more pedestrian friendly.  As this happens it will redevelop with more family friendly residential and begin to transform its character. 

Paris Arc De Triomphe Night2

Jump start State’s redevelopment with something cool - like a large beautiful monument that is on axis with the State capital (think Arc de Triomphe in Paris).  Re-make State Street into a beautiful multi-way boulevard.  While economically the land is going to be more expensive than farmland in surrounding counties, the State Legislature can incentivize this smart growth by buying the land along State Street (with Gas Tax revenue) and re-making it into something better reflective of the “State Street” moniker. 

The Congress for New Urbanism (CNU) has studied the transformative impact of new Boulevards.  Built in 2002, the new Octavia Boulevard in San Francisco was built in the footprint of the old Central Freeway and was designed to be both visually appealing and pedestrian friendly.  Planners also included a new park, Patricia’s Green, as well as generous tree-lined pedestrian walkways. Before the destruction of the Central Freeway, condominium prices in the Hayes Valley neighborhood were 66% of San Francisco average prices. However, after the demolition and subsequent replacement with the new Octavia Boulevard, prices grew to 91% of city average. Beyond this, the most dramatic increases were seen in the areas nearest to the new boulevard. Furthermore, residents noted a significant change in the nature of the commercial establishments in the area. Where it had been previously populated by liquor stores and mechanic shops, soon the area was teeming with trendy restaurants and high-end boutiques.

Tourists flock to great urban walkable cores and State Street connects city after city with a potential for each to be a charming jewel along a beautiful necklace of valley towns and cities.  The legislature re-located the prison, why not re-locate auto oriented uses and acres of asphalt in favor of a more beautiful walkable street that will invite people to live along this well-connected corridor? 

Napoleon I, who initially proposed the Arc de Triomphe, had an ambition to make the capital of his empire the most beautiful city in the world.  It took 30 years, along with imperial defeat and invasion, before the plans of the Arc de Triomphe became reality.  Let’s not wait 30 years to transform State Street.  Like the thousands that circle around the Arc de Triomphe for cycling’s Tour de France, let’s envision the Tour of Utah racing along a new and triumphal State Street.  And when we build that State Street monument, be sure it has an observation deck so our grandchildren can appreciate State Street’s transformation! 

About the Author: Josh Stewart is an architect and urban designer with over 20 years of experience working on transit and community designs. He lives in Salt Lake City.  

On January 31, 2019, CNU Utah invited four people to present at one of the Chapter’s UrbanTHINK events on the topic, “The Future of New Urbanism.” Each person took a very different approach to the topic. Over several weeks, we are posting about their remarks in hopes of inspiring further thought and discussion of where New Urbanism is headed. This fourth and final installment in the series reports on the presentation by Jeff Farnum, Manager of Architecture and Design at Daybreak. Prior to coming to Daybreak, Jeff worked as an architect at 4cdesign group in Park City and at FFKR Architects in Salt Lake. 

Read more ...

On January 31, 2019, CNU Utah invited four people to present at one of the Chapter’s UrbanTHINK events on the topic, “The Future of New Urbanism.” Each person took a very different approach to the topic. Over several weeks, we are posting about their remarks in hopes of inspiring further thought and discussion of where New Urbanism is headed. This third installment in the series reports on the presentation by Christie Oostema-Brown, owner of People + Place, a Salt Lake City consulting firm. Formerly Planning Director with Envision Utah, Christie also chaired the program committee for CNU21 in Salt Lake City. Christie focused her January 31 remarks on issues of loneliness and tribalism – on how we can make better communities through better housing opportunities for everyone.

Read more ...

Mike Hathorne

I have been a member of the Congress for the New Urbanism (CNU) for over 15 years.  In fact, one could argue I have been affiliated with CNU for my entire professional career.  CNU has certainly shaped my thinking for longer than my awareness of CNU as an organization.  I have allowed that influence to drive me professionally to the point of having been put in the position of having to choose between where to live and New Urbanism – choosing between professional relationships and New Urbanism – choosing between employment opportunities and New Urbanism.  New Urbanism won out every time.  Why?  Because it is the absolute correct mindset for making decisions which face us in the present and the foreseeable future.  When I say that, I am speaking specifically about Utah, the Wasatch Front and the challenges that are presently staring us in the face. 

Read more ...

Erica Evans, Investigative Reporter

I moved to Utah about a year and a half ago from California. I have strong family ties to this state, so I had visited many times but never long enough for the air quality to really bother me. That first winter, the air quality was something that I kept noticing and kept hearing people talk about. I went on a hike, and by the time we got to the top, couldn’t see the valley floor. My sister’s boyfriend came to visit for the holidays, he’s her husband now but at the time we were really trying to impress him. We wanted him to like the place where our family is from. But as we were driving through Lehi, this haze set in where we could barely see 5 cars in front of us. And he was like wow, I feel like I’m in Beijing. I felt embarrassed! And I just wanted to know what could be done about it.

Read more ...

A. Paul Glauser, AICP - CNU Utah Board Member

On a recent visit to Washington, DC, I stayed several days at a hotel which didn’t offer free internet in the guest rooms, but it was available in the lobby areas. Consequently, I spent a little of each day camped out with my IPad in the lobby. It became fairly common for other hotel guests coming and going to get off a simple ”Hi” to me, or in some cases to make comments about the hotel’s internet, or about what was on the TV on the wall behind me, or about the university t-shirt I was wearing. And I came to relish these very brief interactions with complete strangers, from backgrounds unknown, who I would never see again but with whom I shared the common bond of being a visitor to the City. A couple of times I actually left my hotel room in the evening and hung out in the lobby for a few minutes in hopes of having more such interactions. 

Read more ...

George Shaw, AICP

The Cairns Plan is the current Master Plan (2017) for Downtown Sandy, referred to previously as the Civic Center and South Town Plans. The area is bordered by 9000 South on the north, the Trax line on the east, 10600 South on the south and I-15 on the west, comprising approximately 1000 acres. The vision of the plan is to create a mixed use City Center in Sandy. Sandy City was one of the first communities in the state to adopt a mixed use zoning classification. Over the years mixed use development has become an integral part of the City’s plan implementation.

Read more ...
Page 1 of 3